
Introduction
Wire and Cable manufacturers of automotive and control wires as well as coax and communication cables, are using measuring and control technologies in their extrusion lines to maintain specified cable parameters. This is important for process optimization and quality assurance but is also demanded when products are assembled automatically. In these cases, assembly failure rates are recorded statistically, registered and assigned to the manufacturer. For this reason, cable plants are aiming to supply cables with reliable high quality standards.
Challenges in the cable extrusion
A challenge in the cable extrusion process is maintaining measurement values with tight tolerances of the conductor concentricity in the insulation, the conductor diameter, the outer diameter of the cable and the ovality of the outer diameter. During the extrusion process deviations of the measuring values can occur, which would remain undetected without special equipment for visualization. Lumps, neckdowns, faults or bare spots in the cable can lead to malfunctions during assembly. Early in the assembly process, the cable or wire is cut to lengths and stripped at the ends in order to be subsequently fitted with plugs. The pull-off forces use for the stripping are exactly defined. Deviations of the pull-off forces within the conductor insulation can cause interferences during the stripping. The use of innovative measuring and control technology allow the cables to meet the high demands requirements and furthermore identify potentials for process optimization of the extrusion line.
Rotating / oscillating conductor
The requirements for measuring and control technologies in cable extrusion lines are very precise where tolerances within a few micrometers have to be maintained. While the mean value of the diameter or the wall thickness of the insulation, is sufficient for controlling the extrusion line, the reliable recording and visualization of short-term variations, especially of the eccentricity values, isadditionally necessary under the aspect of the minimum wall thickness. Slight oscillations of the conductor directly before the crosshead can lead to significant deviations of the concentricity, especially if the conductor is oscillating in one plane or rotating. Such eccentricities cannot be shown with a conventional graphical visualization. A fast rotating vector of a constant eccentricity value can only be displayed to the operator by a visualization beyond the standard display.
Angle position of a conductor
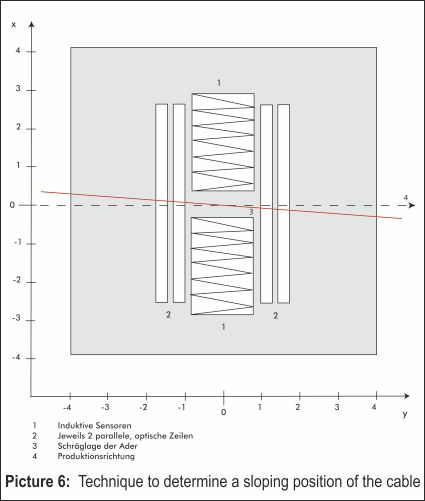
During the extrusion process it is possible that a cable, with or without guide rollers, has a slightly angled position when running through the measuring plane. Eccentricity measuring systems have to be able to generate accurate measuring values even when such a position occurs (see picture 6).
A sag or bend of the conductor
Even on the assumption that the conductor is stretched when running through an extrusion line, it may still show some bends, which have to be detected when entering the gauge head of an eccentricity system. Without any special measures, even invisible curve radii in the range of 5 to 20 meters can lead to eccentricity errors of up to 40 micrometers. Only in an ideal case, guide rollers can compensate this imperfect stretching of the conductor, or vice versa, even increase the error. Therefore, the aim should be to eliminate guide rollers completely.
Measuring the concentricity of a conductor in the insulation ensures a high quality cable will be produced. During manufacturing of the cable, the measuring system should compensate completely the influence of production related variables that can affect the measuring result, such as angledcable positions and curve radii of the conductor. Concentricity systems, in combination with an integrated or external processor system, visualizes the short-term variations of the eccentricity in the form of a scatter plot. The system lays the foundation for the production of high quality cables, and hence ensures a reliable, flawless cable during the assembly process.Subsequently, it contributes to process reliability and additionally to the cost effectiveness.
Measuring system for the concentricity measurement of a conductor in the insulation under the influence of an oscillation, cable angled position or a bend of the cable in the measuring plane

The measuring system (picture 1) is based on an optical and inductive measuring technique. With the inductive measuring system, which is positioned between two optical measuring planes, the exact position of the conductor is determined. With the optical system, the position of the cable is measured. An eccentricity value occurs when both positions differ from each other. Simultaneously, the optical system captures precisely the diameter and the ovality of the cable. All necessary calculations and analysis are carried out in the measuring system. The measuring values are available from different interfaces for transferring data to a display and control unit or to a line computer.
Inductive measuring circuit
The cable passes through a toroidal transformer, which generates an alternating current of a few milliampsinto the conductor. The alternating current createsa magnetic field, which ideally surrounds the conductor in a circular manner and the intensity decreases, exponentially, with the square of the distance.In the measuring system inductive sensors are placed at a determined distance, radial around the conductor. With the help of these sensors, the exact position of the conductor is calculated with high precision from the distribution of the intensity of the magnetic field strength.
Due to the combination of multiple optical sensors and the special design of the inductive sensors, an angled position or a bend in the cable are detected and automatically compensated for. This ensures a precise eccentricity measurement.
Due to the automatic centering of the gauge head to the cable position, the measuring system is able to provide precise measuring values at all times, even when the pulling forces in the cable vary. Guide rollers are unnecessary with automatic adjusting heads.
The arrangement of the inductive measuring system for the determination of the conductor position in the center of the gauge head, in combination with ferro-magnetic shielding, prevents environmental variables from having an influence on the eccentricity measuring value. For that reason, even a passing forklift, a moved cooling trough or changing grounding conditions have no influence on the measuring result.
Optical measuring circuit
The optical measurement is based on the principal of the diffraction analysis combined with pulse-driven laser diodes, the light beam from the diodes projects a shadow of the cable onto the CCD-line sensor in each measuring axis with an exposure time of 0.25 microseconds. The systems measure at 4 axes (at 8 points) the position and the width of the shadow. From the position of the shadow in relation to the determined position of the conductor, signal processors calculate the exact value of the eccentricity and from the widths of the four shadows the outer diameter and the ovality are calculated.

The measuring values of the outer diameter, if required in combination with the conductor diameter (the wall thickness), are suitable to amend the output capacity of the extruder or the haul-off speed of the cable in such a way that the measuring values are set to the respective nominal value. Moreover, measuring values with tight tolerances are of significant importance for the assembly. Each of these values influence the wave impedance (e.g. twisted LAN-cables) and consequently the value for the Structural Return Loss (SRL) of a data transfer cable, especially when deviations of these values occur periodically. With the help of the Fast Fourier-Transformation (FFT), the high scan rate of 2,500 measurements/second is suitable for creating a forecast for the SRL in dependence of the transmission frequency even at line speeds of 3,000 meters/minute for both, current and future CAT-specifications. If a specification is given concerning the minimum wall thickness for the cable insulation, then any eccentricity leads inevitably to an increased consumption of insulation material. Therefore, eccentricities should be reduced for economic reasons.

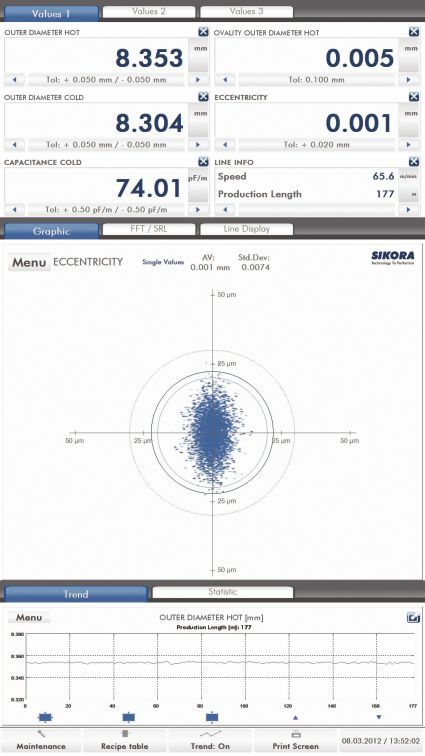
the single values of the eccentricity
Examples for the compensation of production related variables by means of the measuring technique
Recording of oscillating eccentricity values
With a scan rate of 2,500 measurements per second, the measuring system records oscillating eccentricity values with high single value precision. These are visualized in form of a scatter plot (picture 3, 4 and 5). The scatter plot provides an additional way to visualize the ongoing measurement at processor-based display and control devices, and with its help, the distribution of short term variations of the eccentricity can be shown graphically. Each dot represents a single value of the eccentricity concerning value and direction. The overall distribution of the scatter plot highlights the standard deviation of the eccentricity. It is often sufficient to amend the guiding of the conductor close to the cross head in order to avoid these oscillations, which usually occur within a certain speed range and/or certain filling degrees of the coiler or decoiler respectively. The standard way of representing eccentricity using a cross-section of the cable (picture 2) is additionally helpful for the operator when centering the crosshead. Picture 3 shows a random type distribution of the single values of the eccentricity, while picture 4 shows a ring type distribution of the eccentricity values, which is often the result of a rotating (oscillating) conductor prior to the extruder crosshead. Picture 5 is showing an ellipse type distribution of the scatter plot, which can happen, for example, when the conductor is oscillating or vibrating in one direction directly before entering the crosshead and which therefore causes additionally eccentricity variations. This permanent rotation eccentricity would also not be visible with a standard presentation of eccentricity (as shown in picture 2).

the single values of the eccentricity
the single values of the eccentricity
With a scan rate of 2,500 measurements per second, the system records oscillating eccentricity values precisely. These are visualized in the form of a scatter plot (picture 3, 4 and 5). The scatter plot provides an additional visualization of the ongoing measurement at aprocessor-based display, and with its help, the distribution of short term variations of the eccentricity can be shown graphically. Each dot represents a single value of the eccentricity displayed as a value and direction. The overall distribution of the scatter plot highlights the standard deviation of the eccentricity. It is often sufficient to amend the guiding of the conductor close to the cross head in order to avoid these oscillations, which usually occur within a certain speed range and/or certain filling degrees of the coiler or de-coiler respectively. The standard way of representing eccentricity using a cross-section of the cable (picture 2) is additionally helpful for the operator when centering the crosshead. Picture 3 shows a random type distribution of the single values of the eccentricity, while picture 4 shows a ring type distribution of the eccentricity values, which is often the result of a rotating (oscillating) conductor prior to the extruder crosshead. Picture 5 illustrates an ellipse type distribution of the scatter plot, which can happen, for example, when the conductor is oscillating or vibrating in one direction directly before entering the crosshead and which therefore causes eccentricity variations. This eccentricity pattern would also, not be visible with a standard presentation of eccentricity (as shown in picture 2).
In order to ensure a high measuring accuracy of the conductor within the insulation, the optical measurement axes should be positioned at the same level as the inductive sensors. In this positioning, the optical paths are shaded by the inductive sensors. For that reason, the optical measuring planes are divided. One optical measuring plane is arranged before and one after the inductive sensor plane. As a consequence, only an absolute straight and horizontal conductor can generate accurate measuring results. In practice, however, slightly angled positions or bends in the conductor typically have to be expected. This means that the measuring device has to be able to record precise measuring values even under these conditions.
Measurement of a sloping position of the cable
Picture 6 shows a cable running in reference to a straight line. The cable, however, is running in an inclined position to the actual intended production line. In the illustration, the inclined position of the cable is exaggerated for a better understanding. It is known that a straight or inclined line, in this case a straight conductor, is defined by 2 points. By means of the first and second optical measuring device, the sloping positions of the cable will be identified and its influence on the measuring results will be determined and fully compensated.
Determination and compensation of a sag or bend of the cable
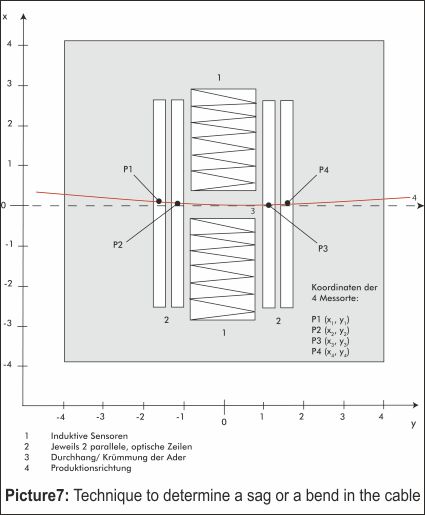
Picture 7 illustrates a cable that shows a sag or bend. For a better understanding, the illustration of the bend of the cable is extremely exaggerated and in practice not likely. The bend of a conductor can be described by a circle, whose position and curve radius is defined by 3 points. With this information, the processor system is able to calculate the exact position of the cable in the inductive measuring plane and to fully compensate for the influence of angled position and/or bends. As shown in the picture, the measuring system is built in a way that the position of the cable is measured at 4 points,shown in the illustration as P1, P2, P3 and P4. Due to this, the measuring system is able to detected even irregular deformations of the conductor.
Conclusion
With the introduced technology it is possible to precisely measure the concentricity of a conductor in the insulation as well as the product parameters, outer diameter, ovality and wall thickness. The measuring technique records rotating or in one plane oscillating eccentricity values of the conductor in form of a scatter plot. This “scatter plot”allows visualization of the distribution of short-term variations of the eccentricity.
Perthe 4-axes measurement as well as 8-point eccentricity measurement, a sloping position of the cable in the measuring plane can be recognized. The measuring system compensates automatically for a sloping position of the conductor in both, horizontal as well as vertical direction, thus the measuring results are not influenced. The measuring system also records accurate measuring values, even when the cable is running through the gauge head with a sag or curved radius.
Using the described measuring technology in extrusion lines ensures the production of high quality cables for a flawless assembly. At the same time, it contributes to process reliability and, consequently, cost effectiveness.
(Courtesy: SIKORA AG)